> For the complete documentation index, see [llms.txt](https://guides.tability.io/docs/llms.txt). Markdown versions of documentation pages are available by appending `.md` to page URLs; this page is available as [Markdown](https://guides.tability.io/docs/become-a-tability-power-user/features/reporting/custom-dashboards.md).
# Custom Dashboards
Use widgets to create tailored dashboards for your needs
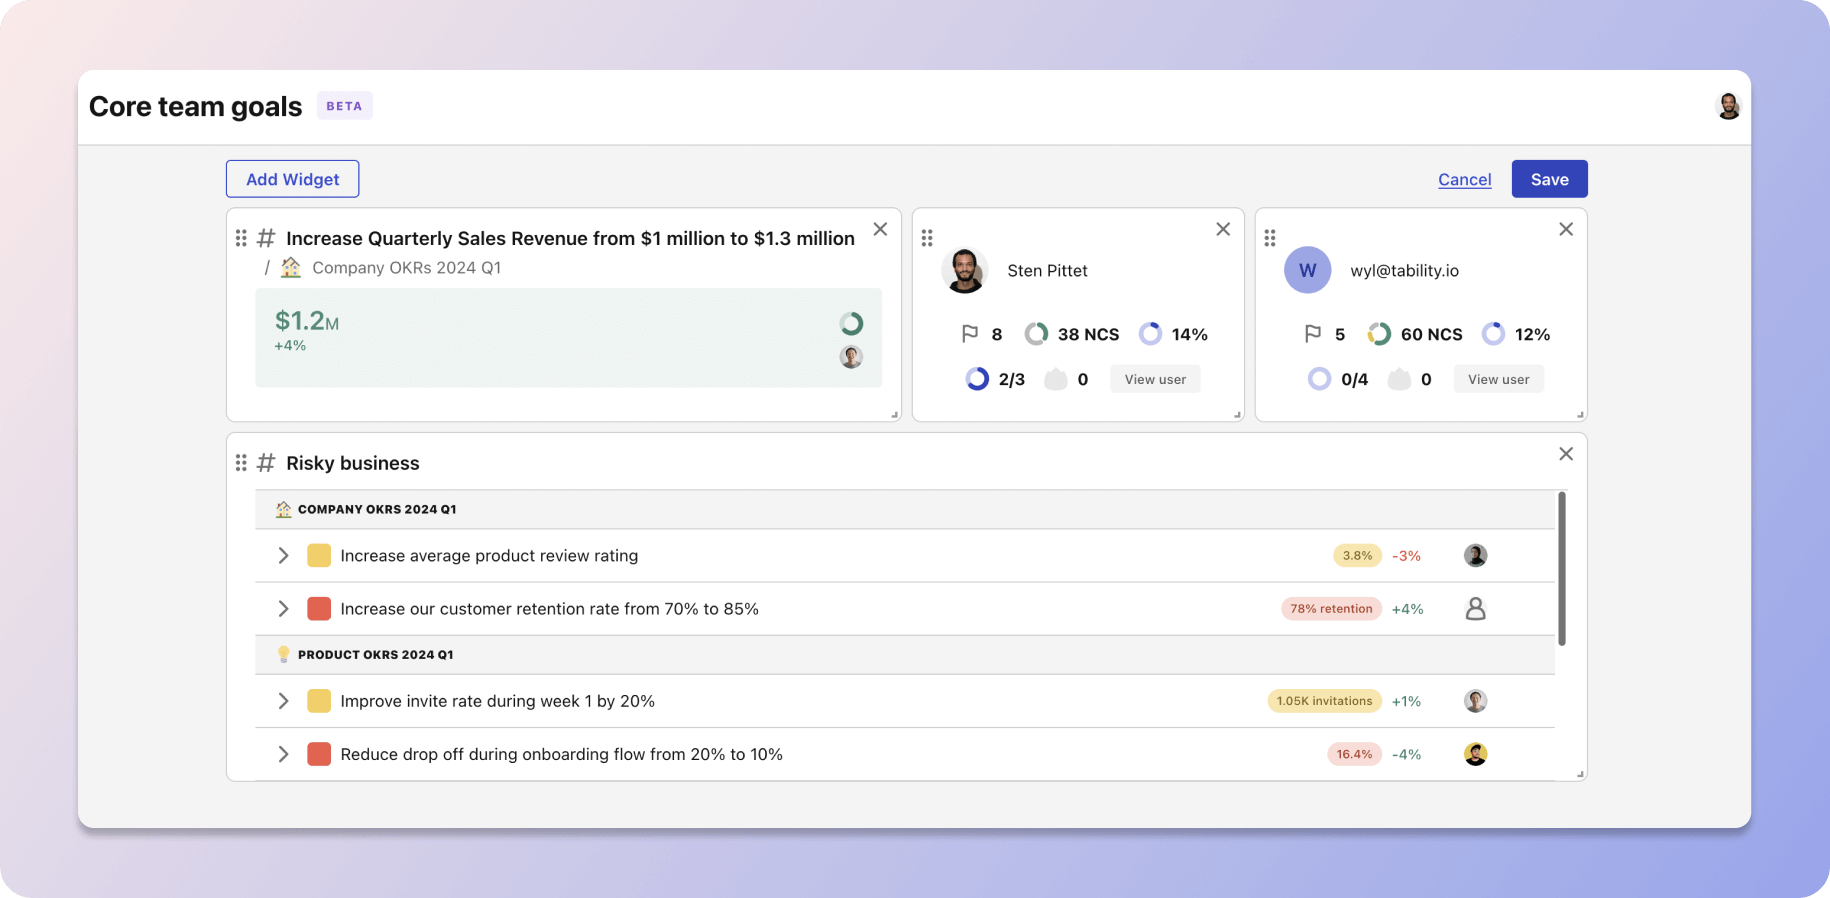
A custom dashboard mode in Tability
## What are Custom Dashboards?
**Custom Dashboards** let you assemble your own reporting view with widgets. They are best when you want one place to monitor a specific team, workflow, or operating rhythm.
For instance, you can create a dashboard that contains:
* A summary of the top-level company OKRs
* Profile widgets for your collaborators
* A list of all the key results that are currently off-track or at-risk
Unlike the built-in **People**, **Outcomes**, and **Tasks** dashboards, custom dashboards are fully editable. Use them when the pre-made dashboards are close but not tailored enough to your use case.
If you need a diagnostic view of how the workspace is being used overall, use [Workspace Insights](/docs/become-a-tability-power-user/features/reporting/workspace-insights.md) instead. Insights is for workspace health and engagement, while custom dashboards are for building your own operational view.
## How to create a new dashboard
Follow these steps to create a new dashboard:
1. Click **Dashboards** in the workspace sidebar.
2. Click on the **Create dashboard** button
3. Give a name to your dashboard and hit **Create**
The **Dashboards** area also includes built-in tabs for **People**, **Outcomes**, **Tasks**, and **Insights**.
### Dashboard content and privacy
* All dashboards live at the workspace level.
* Members only see the data they already have permission to access.
* Read-only users can open dashboards, but they cannot create or edit them.
* You can mark dashboards as favorites for faster access.
## How to add widgets to your dashboard
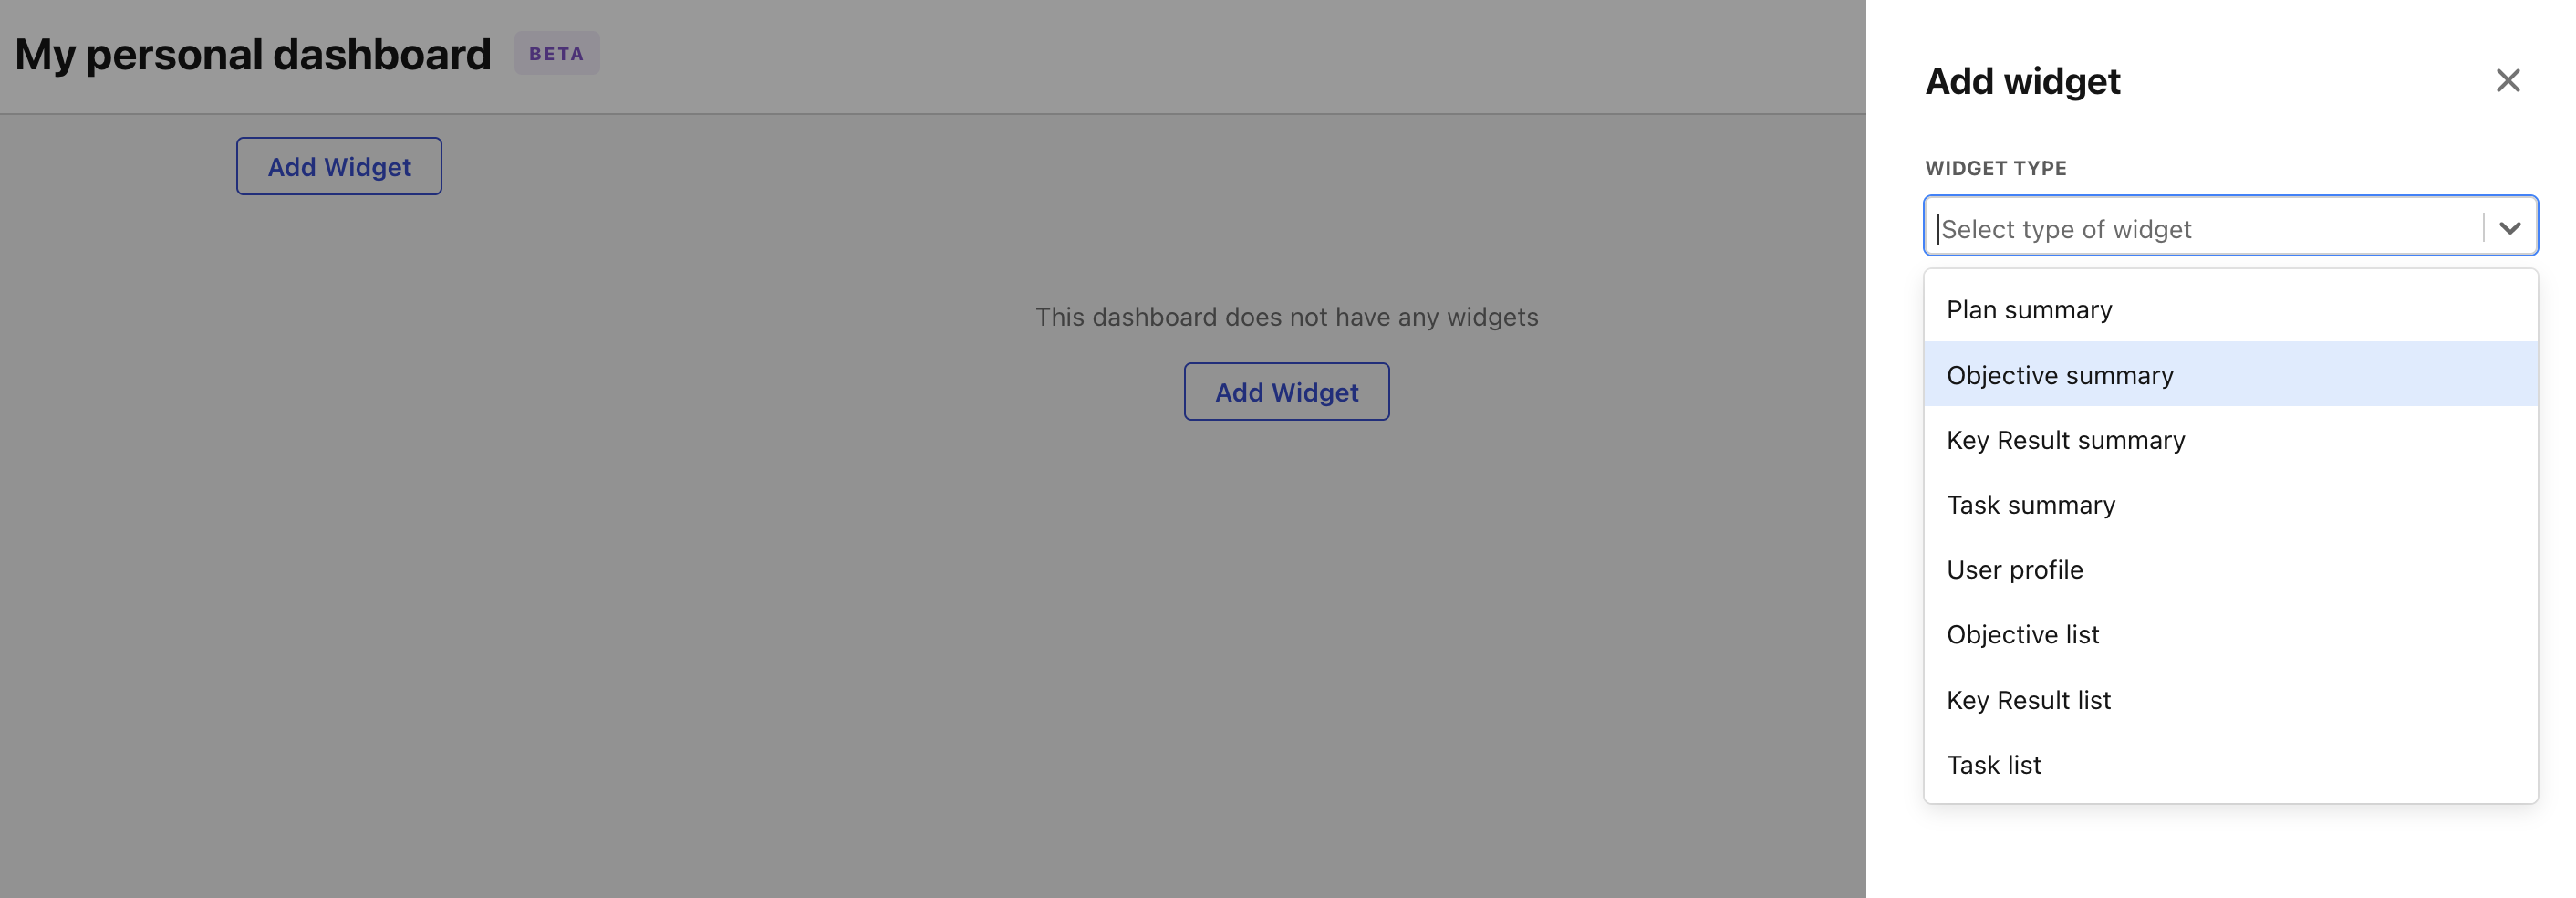
After creating your dashboard, you will be redirected to edit mode. From there you can add widgets by clicking **Add Widget**.
Adding widgets to your dashboards
Once widgets are added, you can resize and rearrange them.
When you're done, click **Save** to return to the dashboard view.
## KPI cards, lists, and charts
With Premium, you can add a headline KPI value, a list of selected KPIs, or a KPI chart showing actuals and targets over time. KPI charts have their own date range and day, week, or month cadence. Configured KPI value cards also use their own date range; dashboard-wide people and date filters do not control KPI widgets.
Each viewer still needs access to the underlying KPI. Sharing the dashboard does not grant that access.
You can ask AI Mode to [build a dashboard](/docs/become-a-tability-power-user/ai-mode-how-tos/build-executive-dashboard.md) or [add a KPI chart to an existing dashboard](/docs/become-a-tability-power-user/ai-mode-how-tos/add-kpi-chart-to-dashboard.md). Review the selected records, settings, and layout before approving the change.
## Common dashboard workflows
Custom dashboards support a few useful workflows beyond basic editing:
* **Duplicate a dashboard** when you want to reuse an existing layout.
* **Favorite dashboards** to pin the ones you use most often.
* **Use built-in dashboards first**, then copy or supplement them with a custom dashboard if you need more control.
## Which reporting surface should you use?
Use **Custom Dashboards** when you want a shared, reusable workspace view that you design yourself.
Use [Workspace Insights](/docs/become-a-tability-power-user/features/reporting/workspace-insights.md) when you want to diagnose workspace usage, plan quality, or engagement patterns.
Use [Presentation Mode](/docs/become-a-tability-power-user/features/reporting/presentation-mode.md) or [TV Mode](/docs/become-a-tability-power-user/features/reporting/tv-mode.md) when you want to review a single plan live with an audience.
Use [Retrospectives](/docs/become-a-tability-power-user/features/reporting/retrospectives.md) when you want to capture written reflections and learnings, not just monitor current status.